作业23答案
用到的包(如提示包不存在可以用install.packages("包名")的方式安装):
library('ggplot2') # 可视化
library('ggthemes') # 可视化
library('scales') # 可视化
library('dplyr') # 数据处理
练习1 数据导入
- 将titanic数据集的训练集的csv文件导入
- 将titanic数据集的测试集的csv文件导入
train <- read.csv('train.csv',stringsAsFactors= FALSE)
test <- read.csv('test.csv',stringsAsFactors= FALSE)
练习2 查看数据
- 查看数据titanic训练集的第四列
- 查看数据集titanic训练集/数据集的变量名
train[,4] #会列出若干行结果
str(train)  #显示变量名,如下
'data.frame':    891 obs. of  12 variables:
 $ PassengerId: int  1 2 3 4 5 6 7 8 9 10 ...
 $ Survived   : int  0 1 1 1 0 0 0 0 1 1 ...
 $ Pclass     : int  3 1 3 1 3 3 1 3 3 2 ...
 $ Name       : chr  "Braund, Mr. Owen Harris" "Cumings, Mrs. John Bradley (Florence Briggs Thayer)" "Heikkinen, Miss. Laina" "Futrelle, Mrs. Jacques Heath (Lily May Peel)" ...
 $ Sex        : chr  "male" "female" "female" "female" ...
 $ Age        : num  22 38 26 35 35 NA 54 2 27 14 ...
 $ SibSp      : int  1 1 0 1 0 0 0 3 0 1 ...
 $ Parch      : int  0 0 0 0 0 0 0 1 2 0 ...
 $ Ticket     : chr  "A/5 21171" "PC 17599" "STON/O2. 3101282" "113803" ...
 $ Fare       : num  7.25 71.28 7.92 53.1 8.05 ...
 $ Cabin      : chr  "" "C85" "" "C123" ...
 $ Embarked   : chr  "S" "C" "S" "S" ...
练习3 数据操作
- 合并训练集和测试集的数据框
- 创建一个包含乘客自己的家庭规模变量
- 离散化家庭规模
total_data <- bind_rows(train,test)

total_data$Fsize <- total_data$SibSp + total_data$Parch + 1

total_data$FsizeD[total_data$Fsize == 1] <- 'singleton'
total_data$FsizeD[total_data$Fsize < 5 & total_data$Fsize > 1] <- 'small'
total_data$FsizeD[total_data$Fsize > 4] <- 'large'
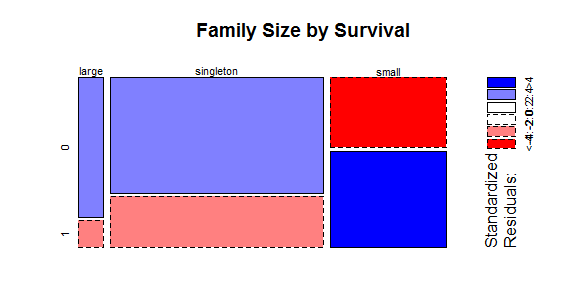
练习4 图形绘制操作
- 用马赛克绘图来显示家庭规模
mosaicplot(table(total_data$FsizeD, total_data$Survived),
           main='Family Size by Survival', shade=TRUE)