实验目的
掌握R语言中箱线图的绘制
实验原理
箱线图(又称盒须图)通过绘制连续型变量的五数总括,即最小值、下四分位数(第25百分位数)、中位数(第50百分位数)、上四分位数(第75百分位数)以及最大值,描述了连续型变量的分布。箱线图能够显示可能为离群点(范围±1.5*IQR以外的值,IQR表示四分位距,即上四分位数与下四分位数的差值)的观测。
实验步骤
下面的例子描绘了美国一家航空公司在1949年到1960年每年的航空乘客数量,该数据集名为AirPassengers,是R自带数据集,其中横坐标表示年份,纵坐标为每年各月份的乘客数量。
> library(ggplot2)
> ggplot(data=AirPassengers_modified,aes(group=year,x=year,y=x))+geom_point(aes(color=factor(year)),
alpha=0.2,position="jitter")+geom_boxplot(outlier.size=0, alpha=0.1) +guides(colour=FALSE)
+ labs(title="每年乘客数量箱线图",x="年份")
抖动散点图被覆盖在箱线图之下。箱子区域包含了50%的点,箱子里的线代表中位数所在的位置,箱子的上边和下边分别代表第一四分位数和第三四分位数所的位置。穿过箱子的线的上端表示距箱子上边1.5*IQR(Q3-Q1)处,线的下端表示距箱子下边1.5*IQR处,一般,在线外的点就可以认为是异常值了。

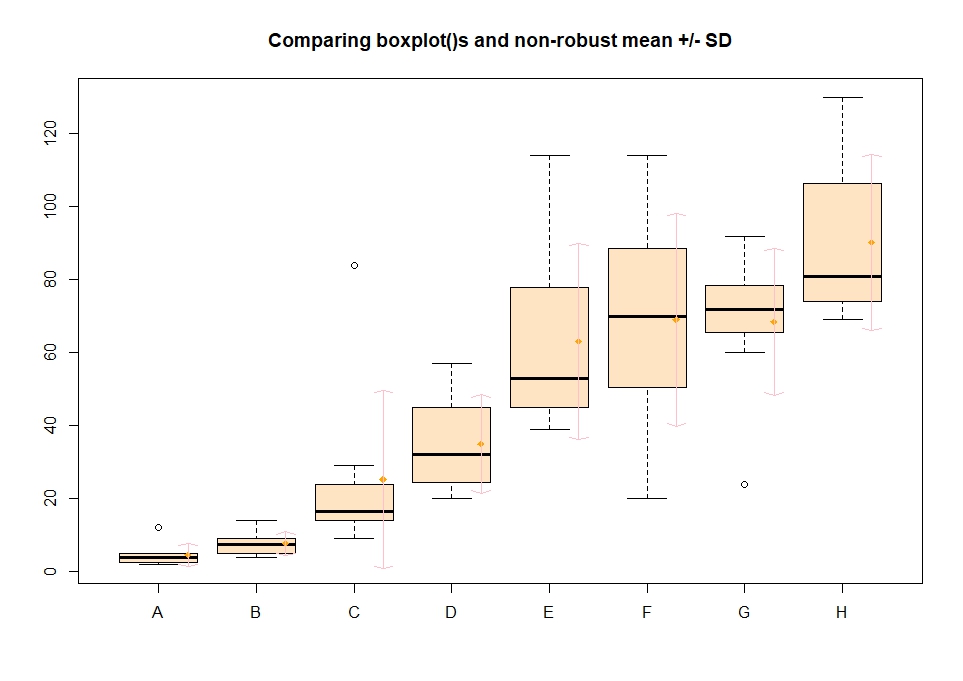
下面使用boxplot()函数绘制箱线图:
> mn.t <- tapply(OrchardSprays$decrease, OrchardSprays$treatment, mean)
> sd.t <- tapply(OrchardSprays$decrease, OrchardSprays$treatment, sd)
> xi <- 0.3 + seq(rb$n)
> points(xi, mn.t, col = "orange", pch = 18)
> arrows(xi, mn.t - sd.t, xi, mn.t + sd.t,
+        code = 3, col = "pink", angle = 75, length = .1)
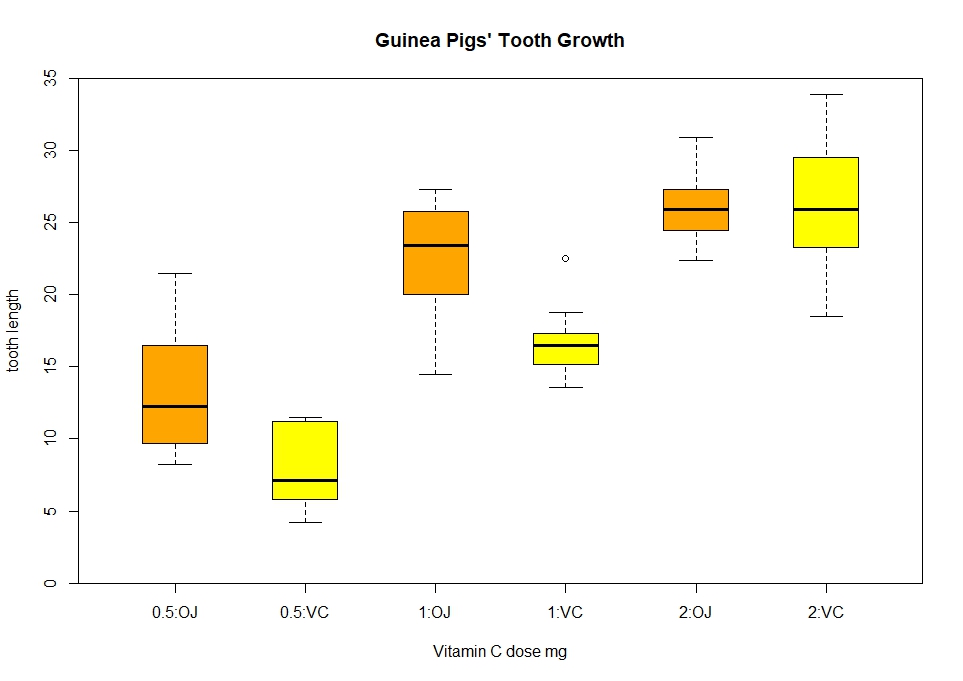
 另一个例子:
> boxplot(len ~ dose:supp, data = ToothGrowth,
+         boxwex = 0.5, col = c("orange", "yellow"),
+         main = "Guinea Pigs' Tooth Growth",
+         xlab = "Vitamin C dose mg", ylab = "tooth length",
+         sep = ":", lex.order = TRUE, ylim = c(0, 35), yaxs = "i")
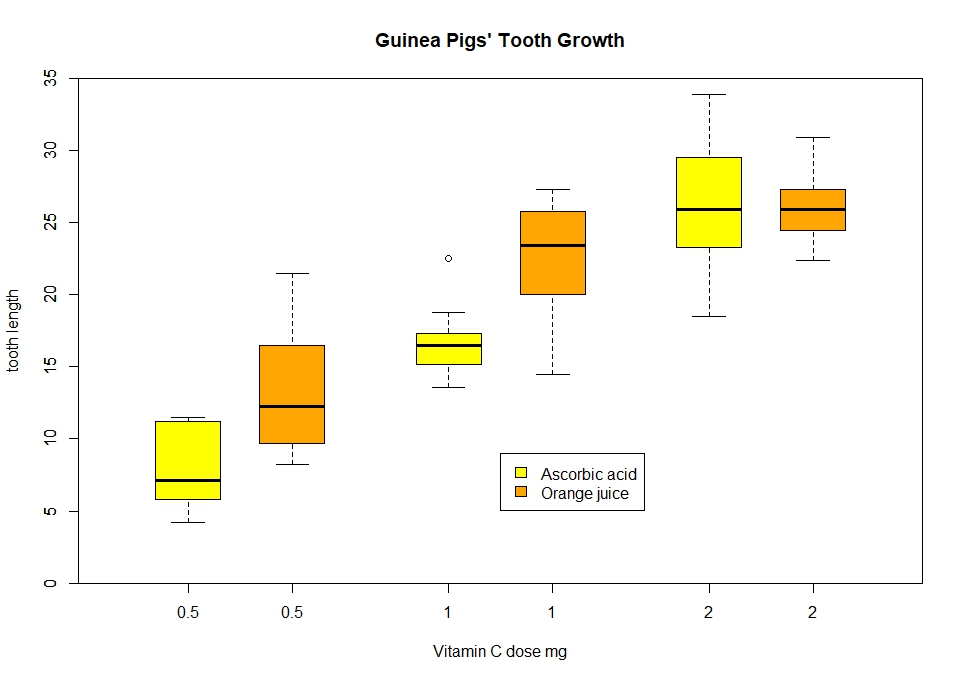
 绘制散点图并添加标题图例:
> boxplot(len ~ dose:supp, data = ToothGrowth,
+         boxwex = 0.5, col = c("orange", "yellow"),
+         main = "Guinea Pigs' Tooth Growth",
+         xlab = "Vitamin C dose mg", ylab = "tooth length",
+         sep = ":", lex.order = TRUE, ylim = c(0, 35), yaxs = "i")
> boxplot(len ~ dose, data = ToothGrowth,
+         boxwex = 0.25, at = 1:3 - 0.2,
+         subset = supp == "VC", col = "yellow",
+         main = "Guinea Pigs' Tooth Growth",
+         xlab = "Vitamin C dose mg",
+         ylab = "tooth length",
+         xlim = c(0.5, 3.5), ylim = c(0, 35), yaxs = "i")
> boxplot(len ~ dose, data = ToothGrowth, add = TRUE,
+         boxwex = 0.25, at = 1:3 + 0.2,
+         subset = supp == "OJ", col = "orange")
> legend(2, 9, c("Ascorbic acid", "Orange juice"),
+        fill = c("yellow", "orange"))