作业27
用到的包(如提示包不存在可以用install.packages("包名")的方式安装):
library('C50')
library('sjmisc')
library('sjstats')
library('ggplot2')
library('pROC')
library('dplyr') # 数据处理
练习1 数据导入
1.将数据集tele_train_small导入
2.命令训练集
3.命名数据集
train <- read.csv("/data/tele_train_small.csv", header = T)
test <- read.csv("/data/tele_train_small.csv", header = T)
练习2 查看数据
1.查看数据集的变量名
str(train)
'data.frame':    3333 obs. of  20 variables:
 $ state                        : Factor w/ 51 levels "AK","AL","AR",..: 17 36 32 36 37 2 20 25 19 50 ...
 $ account_length               : int  128 107 137 84 75 118 121 147 117 141 ...
 $ area_code                    : Factor w/ 3 levels "area_code_408",..: 2 2 2 1 2 3 3 2 1 2 ...
 $ international_plan           : Factor w/ 2 levels "no","yes": 1 1 1 2 2 2 1 2 1 2 ...
 $ voice_mail_plan              : Factor w/ 2 levels "no","yes": 2 2 1 1 1 1 2 1 1 2 ...
 $ number_vmail_messages        : int  25 26 0 0 0 0 24 0 0 37 ...
 $ total_day_minutes            : num  265 162 243 299 167 ...
 $ total_day_calls              : int  110 123 114 71 113 98 88 79 97 84 ...
 $ total_day_charge             : num  45.1 27.5 41.4 50.9 28.3 ...
 $ total_eve_minutes            : num  197.4 195.5 121.2 61.9 148.3 ...
 $ total_eve_calls              : int  99 103 110 88 122 101 108 94 80 111 ...
 $ total_eve_charge             : num  16.78 16.62 10.3 5.26 12.61 ...
 $ total_night_minutes          : num  245 254 163 197 187 ...
 $ total_night_calls            : int  91 103 104 89 121 118 118 96 90 97 ...
 $ total_night_charge           : num  11.01 11.45 7.32 8.86 8.41 ...
 $ total_intl_minutes           : num  10 13.7 12.2 6.6 10.1 6.3 7.5 7.1 8.7 11.2 ...
 $ total_intl_calls             : int  3 3 5 7 3 6 7 6 4 5 ...
 $ total_intl_charge            : num  2.7 3.7 3.29 1.78 2.73 1.7 2.03 1.92 2.35 3.02 ...
 $ number_customer_service_calls: int  1 1 0 2 3 0 3 0 1 0 ...
 $ churn                        : Factor w/ 2 levels "yes","no": 2 2 2 2 2 2 2 2 2 2 ...
2.查看训练集有无缺失值
sum(is.na(train))
[1] 0
练习3 数据操作
1.剔除数据集的第1列变量
train_backup <- train[,-1]
2.合并训练集和测试集的数据框
total_data <- bind_rows(train,test)
练习4 图形绘制操作
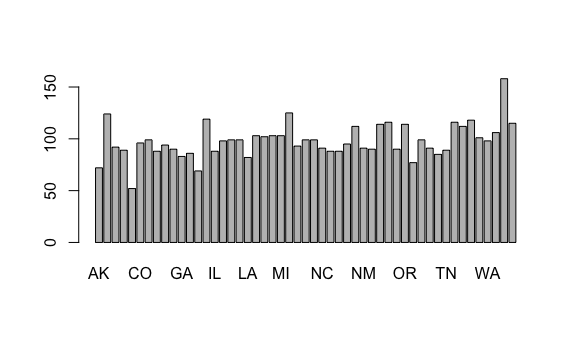
- 画出合并的数据集中state各值出现频数的柱状图
barplot(table(train$state))