作业24答案
用到的包(如提示包不存在可以用install.packages("包名")的方式安装):
library('dplyr')
library('corrplot')
library('rpart')
library('partykit')
library('grid')
library('caret')
library('readr')
library('ggplot2')
library('gmodels')
练习1 数据导入
- 将数据集的csv文件导入
HR<-read.csv('HR_comma_sep.csv',stringsAsFactors=F)
练习2 查看数据
- 查看数据集的所有变量名
- 查看数据有没有缺失值
str(HR)
'data.frame':    14999 obs. of  10 variables:
 $ satisfaction_level   : num  0.38 0.8 0.11 0.72 0.37 0.41 0.1 0.92 0.89 0.42 ...
 $ last_evaluation      : num  0.53 0.86 0.88 0.87 0.52 0.5 0.77 0.85 1 0.53 ...
 $ number_project       : int  2 5 7 5 2 2 6 5 5 2 ...
 $ average_montly_hours : int  157 262 272 223 159 153 247 259 224 142 ...
 $ time_spend_company   : int  3 6 4 5 3 3 4 5 5 3 ...
 $ Work_accident        : int  0 0 0 0 0 0 0 0 0 0 ...
 $ left                 : int  1 1 1 1 1 1 1 1 1 1 ...
 $ promotion_last_5years: int  0 0 0 0 0 0 0 0 0 0 ...
 $ sales                : chr  "sales" "sales" "sales" "sales" ...
 $ salary               : chr  "low" "medium" "medium" "low"

sum(is.na(HR))
[1] 0
练习3 数据操作
- 将原始数据拆分成训练集和测试集
#将变量重命名:
HR<-rename(HR,satisfaction=satisfaction_level,evaluation=last_evaluation,project=number_project,avghours=average_montly_hours,timespend=time_spend_company,accident=Work_accident,promotion=promotion_last_5years,dept=sales)
HR$left<-as.factor(HR$left) #转换为factor类型
set.seed(0001)
train <- createDataPartition(HR$left, p=0.75, list=FALSE)
hr_good_train <- HR[train, ]
hr_good_test <- HR[-train, ]
练习4 图形绘制操作
- 用ggplot画出部门与离职的关系图
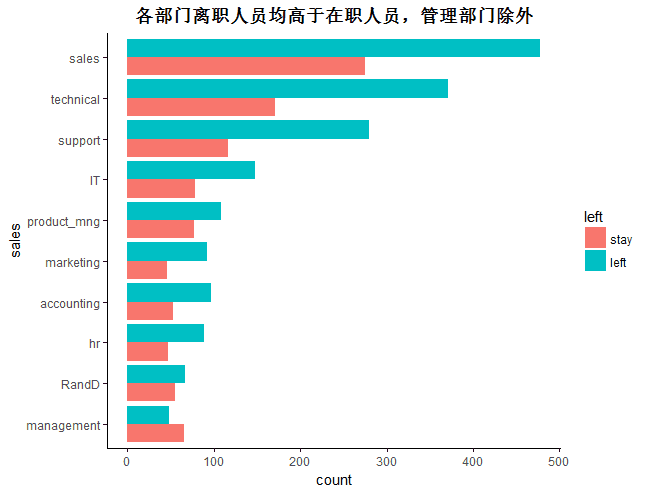
ggplot(hr_good_train, aes(sales, fill=left)) + geom_bar(position="dodge") + coord_flip() + scale_x_discrete(limits=c("management","RandD","hr","accounting","marketing","product_mng","IT","support","technical","sales")) + labs(title="各部门离职人员均高于在职人员,管理部门除外")
